The MoT Files: MoT Test Results By Year of Registration

Tue, 06 May 2014
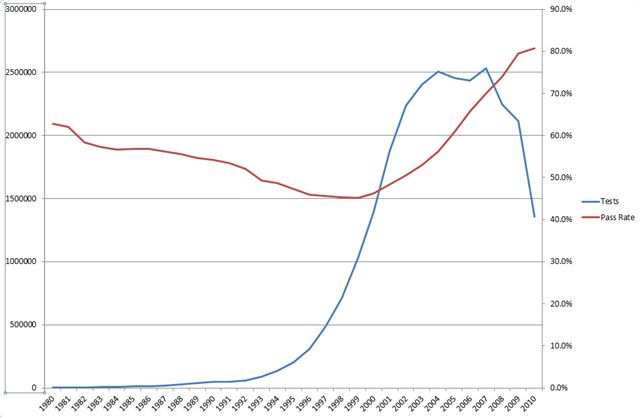
The year of registration and MoT pass rate data gives an indication of the point when cars turn from being 'old bangers' to classics.
The pinch-point is 1999: cars registered in this year have the worst pass rate of any since 1980, which points to this being the year when owners either scrap their cars or invest in maintenance. The pass rate increases again in 1998 and then continues to rise all the way back to 1980, though the number of tests being carried out falls significantly. There are still more than half a million cars registered in 1999 that are still on the road.
Of all the cars registered in the 1980s, it’s the Porsche 911 that tops the chart, with 2786 cars tested showing a 73% pass rate. Hot on the heels of the 911 is the Ford Sierra, with a 71% pass rate
Porsche does well in the 1990s too, with the 911 once again topping the chart with a 75.8% pass rate. Second, with 67% pass rate is the Mercedes-Benz SLK while the Jaguar XK8 takes third with 63% of cars passing.
In fact, when it comes to top 10 cars from the 1990s, both Mercedes-Benz and Jaguar get three entries apiece, with large saloons - like the 190E and XJ6 - filling the middle ground. Range Rover (1994 – 2002) takes seventh place, while the Toyota Starlet and Land Cruiser complete the list.
Then there's the 2000s, which as you'd expect, account for the highest number of MoT tests, despite only running until 2010. There are almost 20 million tests and it's this decade that best reflects what's on the roads now. You'll see everyday cars mixing it with those that cost more than £100,000 new. Topping the decade-wide table is the Toyota iQ, with more than 90% of cars passing the MoT.
Click on the links below to find out how specific models perform in that year:
| Year of Registration | Number of MoT Tests | MoT Pass Rate |
| 1980 | 5358 | 62.7% |
| 1981 | 4072 | 62.1% |
| 1982 | 4700 | 58.3% |
| 1983 | 7168 | 57.3% |
| 1984 | 8119 | 56.7% |
| 1985 | 11034 | 56.9% |
| 1986 | 14460 | 56.8% |
| 1987 | 18562 | 56.2% |
| 1988 | 26513 | 53.6% |
| 1989 | 40548 | 54.7% |
| 1990 | 48950 | 54.2% |
| 1991 | 50563 | 53.5% |
| 1992 | 60259 | 52.1% |
| 1993 | 90256 | 49.4% |
| 1994 | 135735 | 48.7% |
| 1995 | 201892 | 47.4% |
| 1996 | 311065 | 45.9% |
| 1997 | 487735 | 45.6% |
| 1998 | 714296 | 45.2% |
| 1999 | 1028673 | 45.1% |
| 2000 | 1391550 | 46.3% |
| 2001 | 1881021 | 48.4% |
| 2002 | 2236275 | 50.5% |
| 2003 | 2405831 | 53.0% |
| 2004 | 2507847 | 56.2% |
| 2005 | 2455426 | 60.7% |
| 2006 | 2435492 | 65.8% |
| 2007 | 2533515 | 70.0% |
| 2008 | 2244571 | 73.9% |
| 2009 | 2112363 | 79.4% |
| 2010 | 1357715 | 80.7% |
See also:
MoT results for cars registered in the 1980s
MoT results for cars registered in the 1990s
MoT results for cars registered in the 2000s