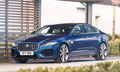
Jaguar XF MOT Results
Registered in 201685.2% pass rate
from 9,009 tests in 2021
(11% better than other 2016 cars)
Pass rate by mileage
More MoT Results
Failure rates by item
Here you can drill down into the failure rates for each item on the test. We've also compared the rates to the average results for 2016 cars and highlighted areas where the Jaguar XF is unusually good or bad.
-
4.1% fail on
Tyres
- 2.2% fail on Condition
- 2.0% fail on Tread depth
- 0.033% fail on Size/type
-
3.8% fail on
Visibility
- 3.4% fail on Wipers (19% worse than other 2016 cars)
- 0.34% fail on Washers (69% better than other 2016 cars)
- 0.056% fail on Bonnet
- 0.022% fail on Driver's view
-
0.011% fail on
Condition of glass
- 0.011% fail on Windscreen
-
3.3% fail on
Brakes
(19% worse than other 2016 cars)
-
2.4% fail on
Mechanical brake components
(26% worse than other 2016 cars)
-
2.0% fail on
Brake linings and pads
(27% worse than other 2016 cars)
- 2.0% fail on Brake pads (27% worse than other 2016 cars)
- 0.011% fail on Brake linings
-
0.60% fail on
Brake discs and drums
- 0.60% fail on Brake discs
-
2.0% fail on
Brake linings and pads
(27% worse than other 2016 cars)
-
0.52% fail on
ABS / EBS / ESC
(5 times worse than other 2016 cars)
- 0.50% fail on Anti-lock braking system (11 times worse than other 2016 cars)
- 0.27% fail on Electronic stability control (4 times worse than other 2016 cars)
- 0.022% fail on Electronic braking system
-
0.51% fail on
Brake performance
-
0.27% fail on
Service brake performance
-
0.26% fail on
Rbt
- 0.19% fail on Service brake performance
- 0.067% fail on Service brake imbalance
-
0.011% fail on
Plate brake tester
- 0.011% fail on Service brake performance
-
0.26% fail on
Rbt
-
0.12% fail on
Parking brake efficiency (sp)
- 0.11% fail on Rbt (sp)
- 0.011% fail on Plate brake tester (sp)
- 0.089% fail on Brake performance not tested
-
0.056% fail on
Service Brake Efficiency (sp)
-
0.056% fail on
Rbt (sp)
- 0.033% fail on Service brake imbalance
- 0.022% fail on Service brake performance
-
0.056% fail on
Rbt (sp)
-
0.011% fail on
Parking brake performance
-
0.011% fail on
Rbt
- 0.011% fail on Parking brake performance
-
0.011% fail on
Rbt
-
0.27% fail on
Service brake performance
- 0.089% fail on Flexible brake hoses (170% worse than other 2016 cars)
-
0.078% fail on
Service brake pedal or hand lever
- 0.078% fail on Pedal
-
0.033% fail on
Parking brake control
- 0.033% fail on Electronic parking brake
-
0.011% fail on
Hydraulic systems
- 0.011% fail on Reservoirs
-
0.011% fail on
Brake actuators (including spring brakes or hydraulic cylinders)
- 0.011% fail on Hydraulic brake cylinder
-
2.4% fail on
Mechanical brake components
(26% worse than other 2016 cars)
-
1.8% fail on
Lamps, reflectors and electrical equipment
(50% better than other 2016 cars)
-
1.1% fail on
Headlamp aim
- 1.1% fail on Headlamp aim
-
0.40% fail on
Headlamps
(45% better than other 2016 cars)
- 0.26% fail on Headlamp cleaning device (4 times worse than other 2016 cars)
- 0.16% fail on Headlamp (76% better than other 2016 cars)
- 0.011% fail on Headlamp levelling device
-
0.14% fail on
Direction indicators
(60% better than other 2016 cars)
-
0.14% fail on
Flashing type
(60% better than other 2016 cars)
- 0.078% fail on Individual direction indicators
- 0.067% fail on Side repeaters (76% better than other 2016 cars)
-
0.14% fail on
Flashing type
(60% better than other 2016 cars)
- 0.056% fail on Stop lamp (91% better than other 2016 cars)
- 0.044% fail on Registration plate lamp(s) (87% better than other 2016 cars)
-
0.044% fail on
Electrical equipment
- 0.044% fail on Horn
-
1.1% fail on
Headlamp aim
-
0.80% fail on
Noise, emissions and leaks
-
0.79% fail on
Exhaust emissions
-
0.58% fail on
Compression ignition
(69% worse than other 2016 cars)
- 0.44% fail on Malfunction indicator lamp (77% worse than other 2016 cars)
- 0.078% fail on On or after 01/01/2014
- 0.044% fail on Emissions not tested
-
0.022% fail on
Emission control equipment
(7 times worse than other 2016 cars)
- 0.022% fail on Particulate filter (26 times worse than other 2016 cars)
- 0.011% fail on Pre 01/07/2008 Turbo
-
0.21% fail on
Spark ignition
(55% better than other 2016 cars)
- 0.19% fail on Malfunction indicator lamp
-
0.011% fail on
Emission control equipment
- 0.011% fail on Oxygen sensor
- 0.011% fail on Catalyst emissions
-
0.58% fail on
Compression ignition
(69% worse than other 2016 cars)
-
0.011% fail on
Fluid leaks
- 0.011% fail on Other leaks
-
0.79% fail on
Exhaust emissions
-
0.58% fail on
Identification of the vehicle
(170% worse than other 2016 cars)
- 0.58% fail on Registration plates (170% worse than other 2016 cars)
-
0.52% fail on
Seat belts and supplementary restraint systems
(82% worse than other 2016 cars)
- 0.39% fail on SRS malfunction indicator lamp (2 times worse than other 2016 cars)
-
0.11% fail on
Seat belts
- 0.100% fail on Condition
- 0.011% fail on Requirements
-
0.033% fail on
Airbags
(6 times worse than other 2016 cars)
- 0.033% fail on Drivers airbag (8 times worse than other 2016 cars)
-
0.37% fail on
Suspension
(82% better than other 2016 cars)
-
0.13% fail on
Suspension arms
(73% better than other 2016 cars)
- 0.100% fail on Pins and bushes (59% better than other 2016 cars)
- 0.022% fail on Suspension arm
- 0.011% fail on Ball joint dust cover
-
0.100% fail on
Springs
(91% better than other 2016 cars)
-
0.100% fail on
Coil springs
(91% better than other 2016 cars)
- 0.100% fail on Coil spring (91% better than other 2016 cars)
-
0.100% fail on
Coil springs
(91% better than other 2016 cars)
- 0.089% fail on Wheel bearings
-
0.022% fail on
Anti-roll bars
(89% better than other 2016 cars)
- 0.011% fail on Ball joint
- 0.011% fail on Linkage ball joint dust cover
- 0.011% fail on Shock absorbers
-
0.011% fail on
Suspension rods
- 0.011% fail on Pins and bushes
-
0.13% fail on
Suspension arms
(73% better than other 2016 cars)
-
0.34% fail on
Body, chassis, structure
(37% better than other 2016 cars)
-
0.21% fail on
Doors
(4 times worse than other 2016 cars)
-
0.20% fail on
Other passenger's door
(9 times worse than other 2016 cars)
- 0.20% fail on Door condition (9 times worse than other 2016 cars)
-
0.011% fail on
Front passenger's door
- 0.011% fail on Door condition
-
0.20% fail on
Other passenger's door
(9 times worse than other 2016 cars)
- 0.044% fail on Exhaust system (72% better than other 2016 cars)
- 0.033% fail on Bumpers
-
0.022% fail on
Fuel system
- 0.011% fail on Hose
- 0.011% fail on System
-
0.022% fail on
Seats
- 0.022% fail on Driver's seat
- 0.011% fail on Undertray
-
0.21% fail on
Doors
(4 times worse than other 2016 cars)
-
0.29% fail on
Road Wheels
- 0.22% fail on Attachment
- 0.067% fail on Condition
-
0.056% fail on
Steering
(79% better than other 2016 cars)
-
0.022% fail on
Steering gear
- 0.022% fail on Steering rack
-
0.022% fail on
Steering linkage components
(90% better than other 2016 cars)
- 0.011% fail on Drag link end
- 0.011% fail on Steering arm
- 0.011% fail on Steering wheel
-
0.022% fail on
Steering gear
Read the Honest John Review
-
 Jaguar XF (2015 - 2024)
Great blend of ride quality and enjoyable handling. Comfortable and refined. Well-equipped as standard. Fleet-friendly diesel engine.
Jaguar XF (2015 - 2024)
Great blend of ride quality and enjoyable handling. Comfortable and refined. Well-equipped as standard. Fleet-friendly diesel engine.


